State the topic
Identify what the image shows in one clear opening sentence.
Upload a chart, map, process diagram, or photo and generate a structured 70–90 word English answer. Use it to practise selecting key information and speaking in your own words—not to predict an official score.
ImageDescriber TeamPrivacy
Practice tool
Upload a chart, map, process diagram, or photo. The tool creates one 70–90 word English answer for content-organization practice.
Or try an original sample
Images are temporarily processed for analysis. Review the output before practicing.
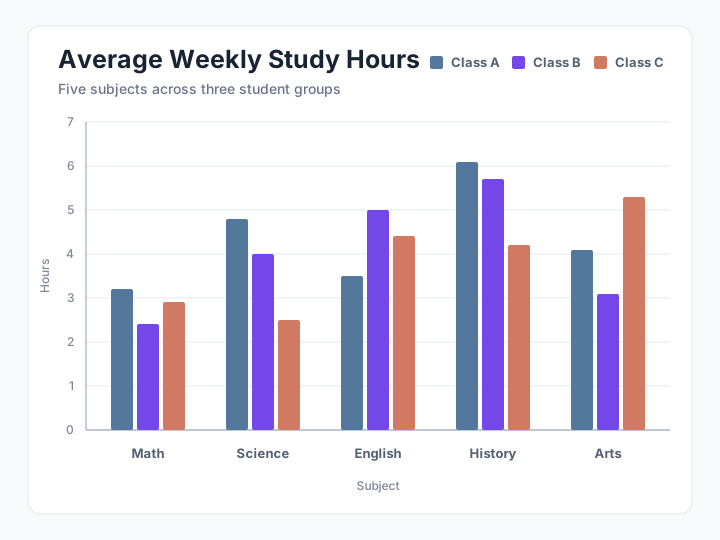
The image presents a grouped bar chart comparing five categories across three data series.
Overall, the fourth category records the strongest combined performance, with blue reaching the highest point and violet close behind.
In conclusion, the chart shows substantial variation across the categories and series.
Flexible speaking framework
A useful framework keeps the response organized while leaving room for the actual image. Aim for one connected paragraph with a clear beginning, evidence, and conclusion.
Identify what the image shows in one clear opening sentence.
Explain the dominant trend, comparison, sequence, or visual focus.
Select useful visible evidence. Do not list every number or object.
Finish with the overall pattern or purpose in a natural closing sentence.
The current Pearson pages describe the same core timing for Describe Image: 25 seconds to study the image and up to 40 seconds to answer.
25 sec
to study the image
Up to 40 sec
to speak your answer
3 scoring traits
content, oral fluency, pronunciation
Original practice materials
These visuals and answers were created for ImageDescriber practice. They are not copied from Pearson questions. Notice how each answer prioritizes the main message rather than describing every detail.
Practice 1
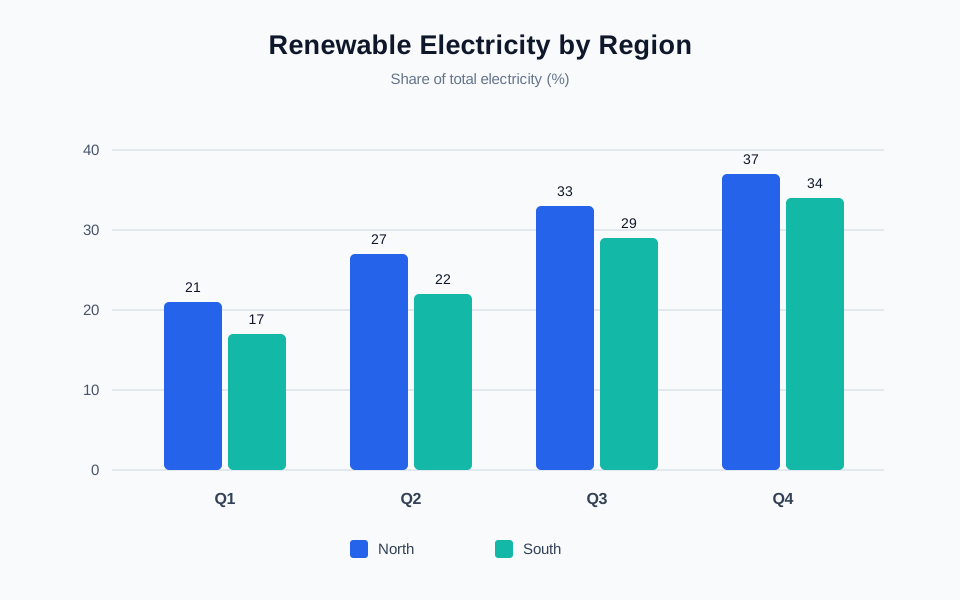
The bar chart compares the share of renewable electricity in the North and South across four quarters. Overall, both regions show steady growth, while the North remains higher throughout the year. In the North, the figure rises from 21 percent in the first quarter to 37 percent in the fourth. The South follows a similar pattern, increasing from 17 to 34 percent. In conclusion, renewable electricity expands consistently in both regions, with the gap narrowing slightly by year end.
Answer length: 79 words
Practice 2
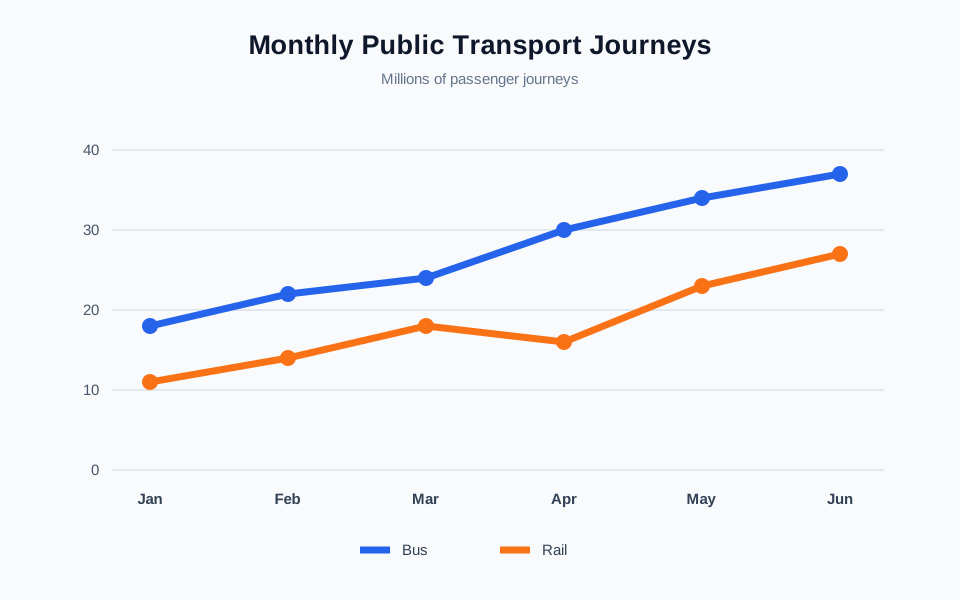
The line chart shows monthly passenger journeys by bus and rail from January to June. The main feature is that both modes finish above their starting levels, although rail changes less consistently. Bus travel climbs from about 18 million journeys in January to roughly 37 million in June. Rail rises from around 11 million to 27 million, despite a small fall in April. Overall, bus remains the more widely used option and records the stronger increase over the period.
Answer length: 79 words
Practice 3
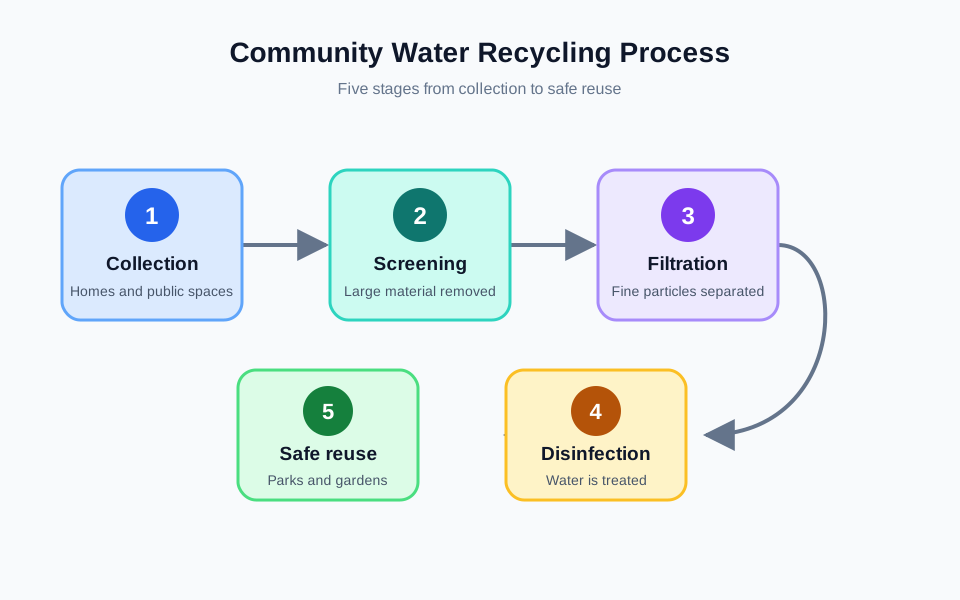
The diagram illustrates a five-stage community water recycling process, beginning with collection and ending with safe reuse. First, water from homes and public spaces is collected before large material is removed during screening. It then passes through filtration, which separates finer particles. The fourth stage disinfects the treated water, and the final stage directs it to parks and gardens. Overall, the process uses several connected cleaning steps to turn collected water into a resource that can be reused safely.
Answer length: 79 words

Practice 4
The photograph presents a calm street scene centered on a bicycle near an outdoor café. The main focus is the bicycle in the foreground, while tables, chairs, and the building frontage create the setting behind it. Warm light and soft shadows suggest pleasant daytime conditions, and the limited number of people makes the area appear quiet. Overall, the image combines transport and leisure elements to show an inviting urban environment with a relaxed and orderly atmosphere.
Answer length: 76 words
Common mistakes
A polished script cannot compensate for missing the image’s central information. Use the visual as the source of truth.
A generic template can sound unnatural and may not fit a process, map, chart, and photo equally well.
Choose two meaningful details and explain their relationship instead of reading every label.
Say a value or label is not fully legible. Never invent a number to make the answer sound complete.
Leave enough time for a short conclusion and stop before the 40-second response window ends.
The PTE mode asks the vision model to identify the topic, main feature, two visible details, and a conclusion. It is instructed to produce one 70–90 word English paragraph and to flag unreadable information instead of guessing.
AI may overlook small labels, interpret a visual relationship incorrectly, or produce wording that does not match your speaking level. Compare the answer with the image and revise it.
Use the result to learn content selection and organization. The tool does not reproduce Pearson scoring, record speech, or assess content accuracy beyond the model’s visual analysis.
Why this page exists: to give learners a focused, transparent way to turn their own practice visuals into structured speaking material. Read our privacy policy before uploading sensitive material.
Answer-first guide
Use the homepage for detailed visual descriptions, Accessibility Mode for concise alt text, or Extract Text when you only need visible words.